Case study · JTL-Wawi
KPI dashboard for JTL-Wawi: sales, stock and margin at a glance
A read-only dashboard in the browser instead of fiddling with JTL statistics: hourly synced, cleaned-up figures on sales, stock, customers and margin. For the whole team, without the JTL client and without any risk to the ERP system.
- System
- JTL-Wawi
- Industry
- Fashion retail
The starting point
What wasn't working
All the numbers live in JTL-Wawi, but getting them out is everyday work: clicking statistics together, rebuilding exports in Excel, cleaning up values by hand. Anyone who quickly wants to know how the month is going, which brand really makes money or which retailer has gone quiet needs time and a JTL workstation.
On top of that, raw data likes to lie. Cancelled orders distort revenue, foreign-currency orders show up in the wrong currency, consolidated invoices get counted twice. A retail company therefore wanted a reporting layer the whole team could trust, available from a desk, tablet or phone.
The solution
How it works
The solution is a dedicated KPI dashboard in the browser: a sync service copies the JTL data every hour into a separate reporting database, where it's cleaned, converted and pre-aggregated. The dashboard only reads; nothing is ever written back to the ERP system. So the team can't break anything.
The figures are prepared so you can rely on them: cancellations are removed from all revenue figures (with their own cancellation report), foreign currencies are converted to euros, and consolidated invoice constructs are counted only once. Every figure is compared with the previous period of the same length, and every list can be filtered, sorted and exported with one click, just like in Excel.
The real value is in the reports: a reorder radar that sets top sellers against stock coverage in weeks, a real margin analysis per brand based on the prices actually achieved, sell-off lists for broken size runs and old stock, and ready-made sales lists of active and inactive B2B retailers.
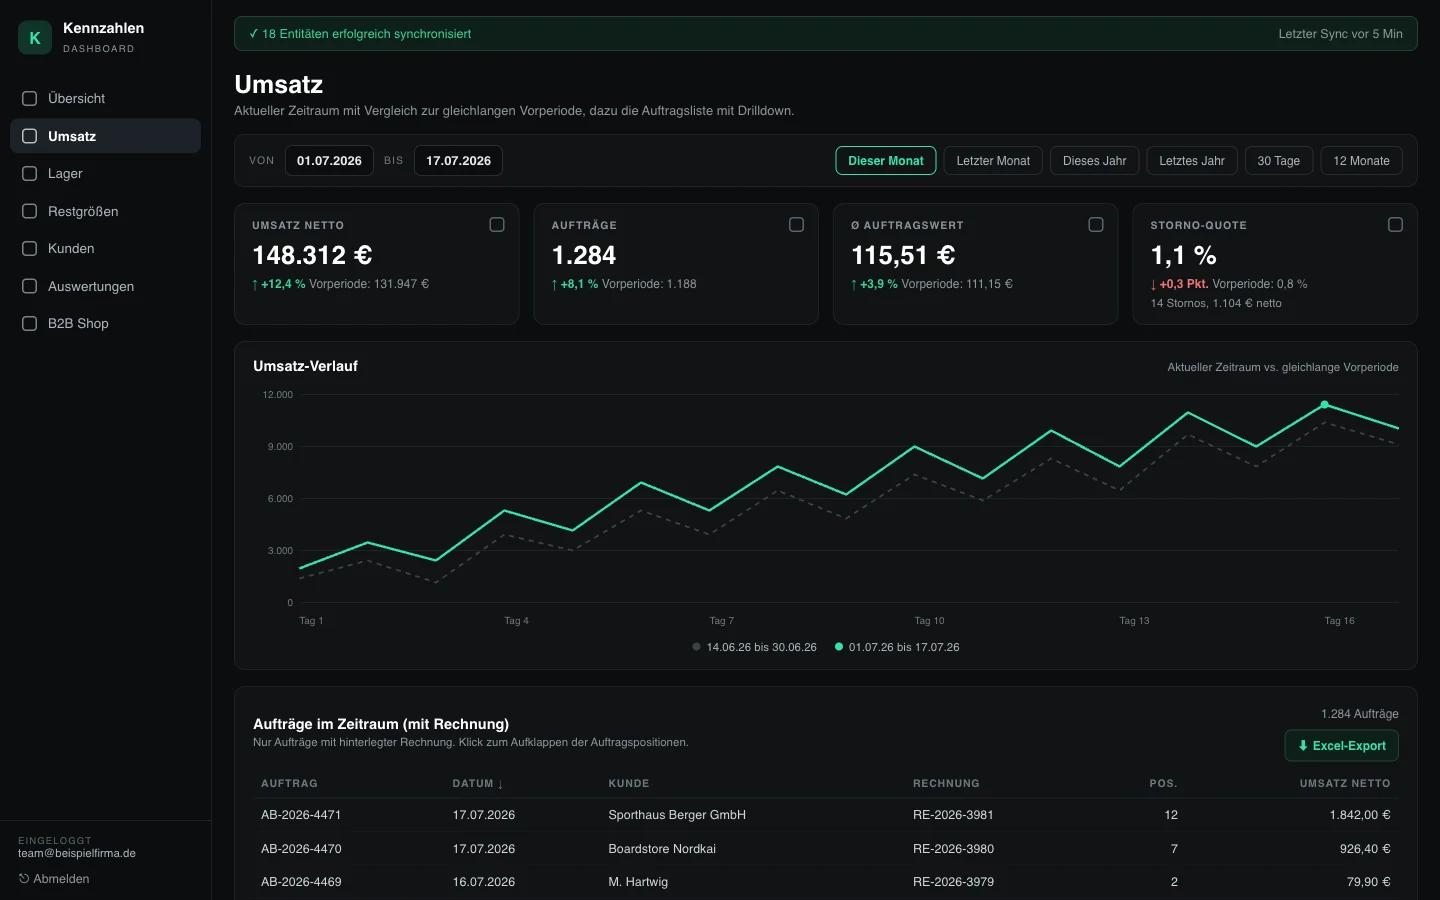
The dashboard's revenue view. All data shown is sample data for illustration.
Sales & orders
Key figures compared with the previous period, a day-by-day trend, the list of invoiced orders with drill-down to line items, and a dedicated cancellation overview.
any time range
Stock & broken sizes
Stock and inventory value per product and size, plus a list of sell-off candidates: old stock with broken size runs that ties up warehouse space and capital.
incl. tied-up capital
Customers & sales
Top customers in the period, active and inactive B2B retailers as a ready-made call list for reactivation, and the new customer trend as an early indicator.
ready-made sales lists
Reports & margin
Revenue by brand, season, channel and country with drill-down. Plus the reorder radar with coverage in weeks and the real margin per brand as a basis for negotiations.
incl. reorder radar
The result
What it changes day to day
- Key figures in seconds instead of fiddling with statistics: checking on the month takes a login, not a JTL workstation
- Figures you can rely on: cancellations removed, currencies unified, nothing counted twice
- The reorder radar warns you before top sellers sell out
- The margin analysis shows which brand really makes money, not just which one brings in revenue
- Inactive retailers are ready as a call list for the sales team
- Zero risk to the ERP system: the dashboard only reads and never writes back
For your business
What you get
I can set this solution up in your business too: adapted to your processes and documented so your team can work with it right away.
Setup with starter reports at a fixed price, more reports on request. Quote after a short, free initial call.
- Setting up the sync service and reporting database, including hourly sync
- Dashboard with login for your team, usable on desktop, tablet and phone
- A starter set of reports based on your questions, with more reports added on request
- Excel export in every list, keeping the filters and sorting you've set
- A clear user manual so the team interprets the figures correctly
FAQ
Quick answers
Does the dashboard change anything in my JTL-Wawi?
No. It syncs the data into its own database and only displays it. Nothing is written back to the ERP system, so your team can't break anything.
How up to date are the figures?
The sync runs every hour, and a banner in the dashboard shows the last run. Other intervals are possible; for daily and monthly decisions, hourly has proven itself.
Why do the figures differ from JTL's statistics?
Because they're deliberately cleaned up: cancellations are removed, foreign currencies converted to euros, consolidated invoices counted only once. That's exactly what makes the figures comparable and reliable.
Can I get my own reports?
Yes, that's the core of the concept: the dashboard starts with a set of reports and grows with your questions. New reports are added without changing anything in the system.
What do I need?
A JTL-Wawi with read access via SQL and a place for the reporting database, either on your server or hosted. We clarify the details in a short, free initial call.
Want this running in your business?
Describe your current process in two sentences. I'll get back to you with an honest assessment of what's possible.
Send a no-obligation request